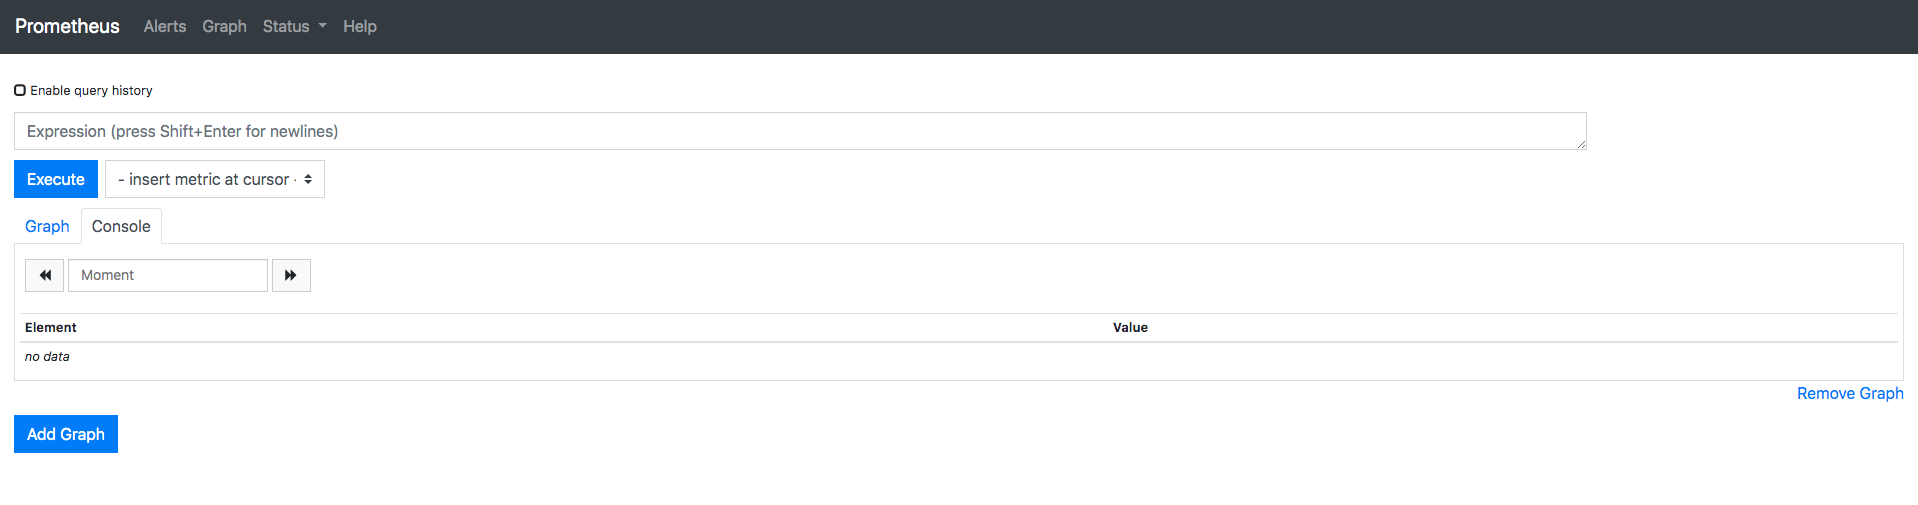
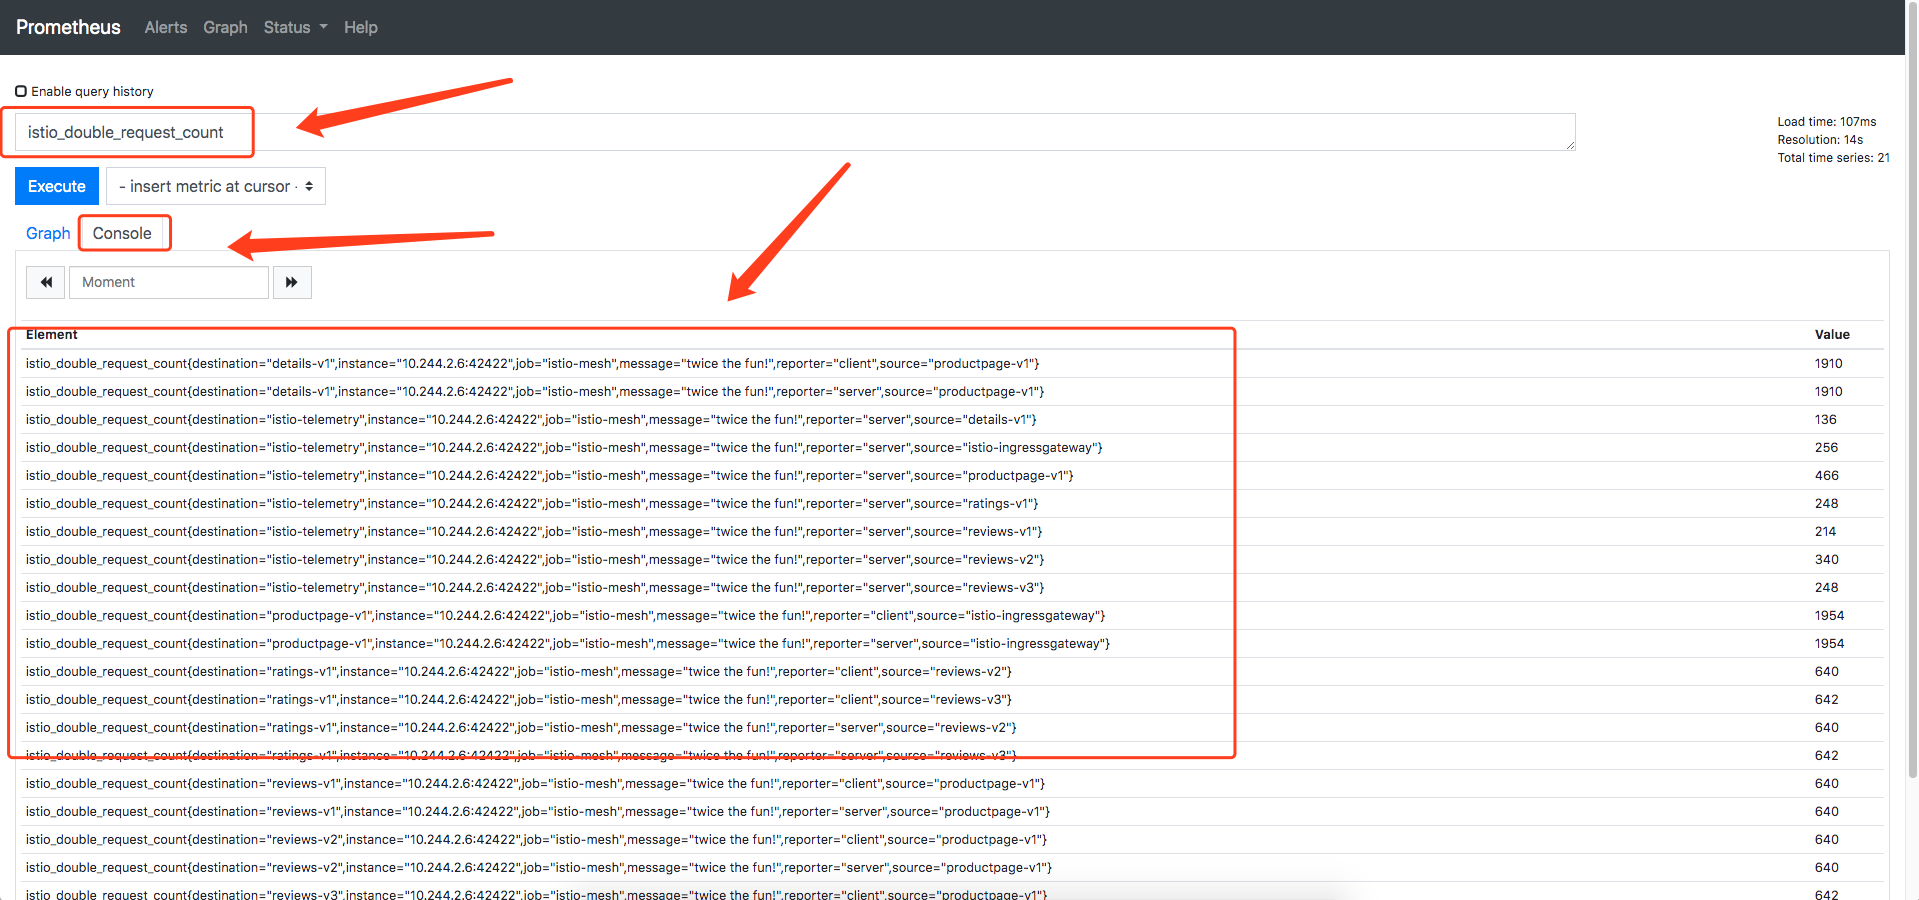
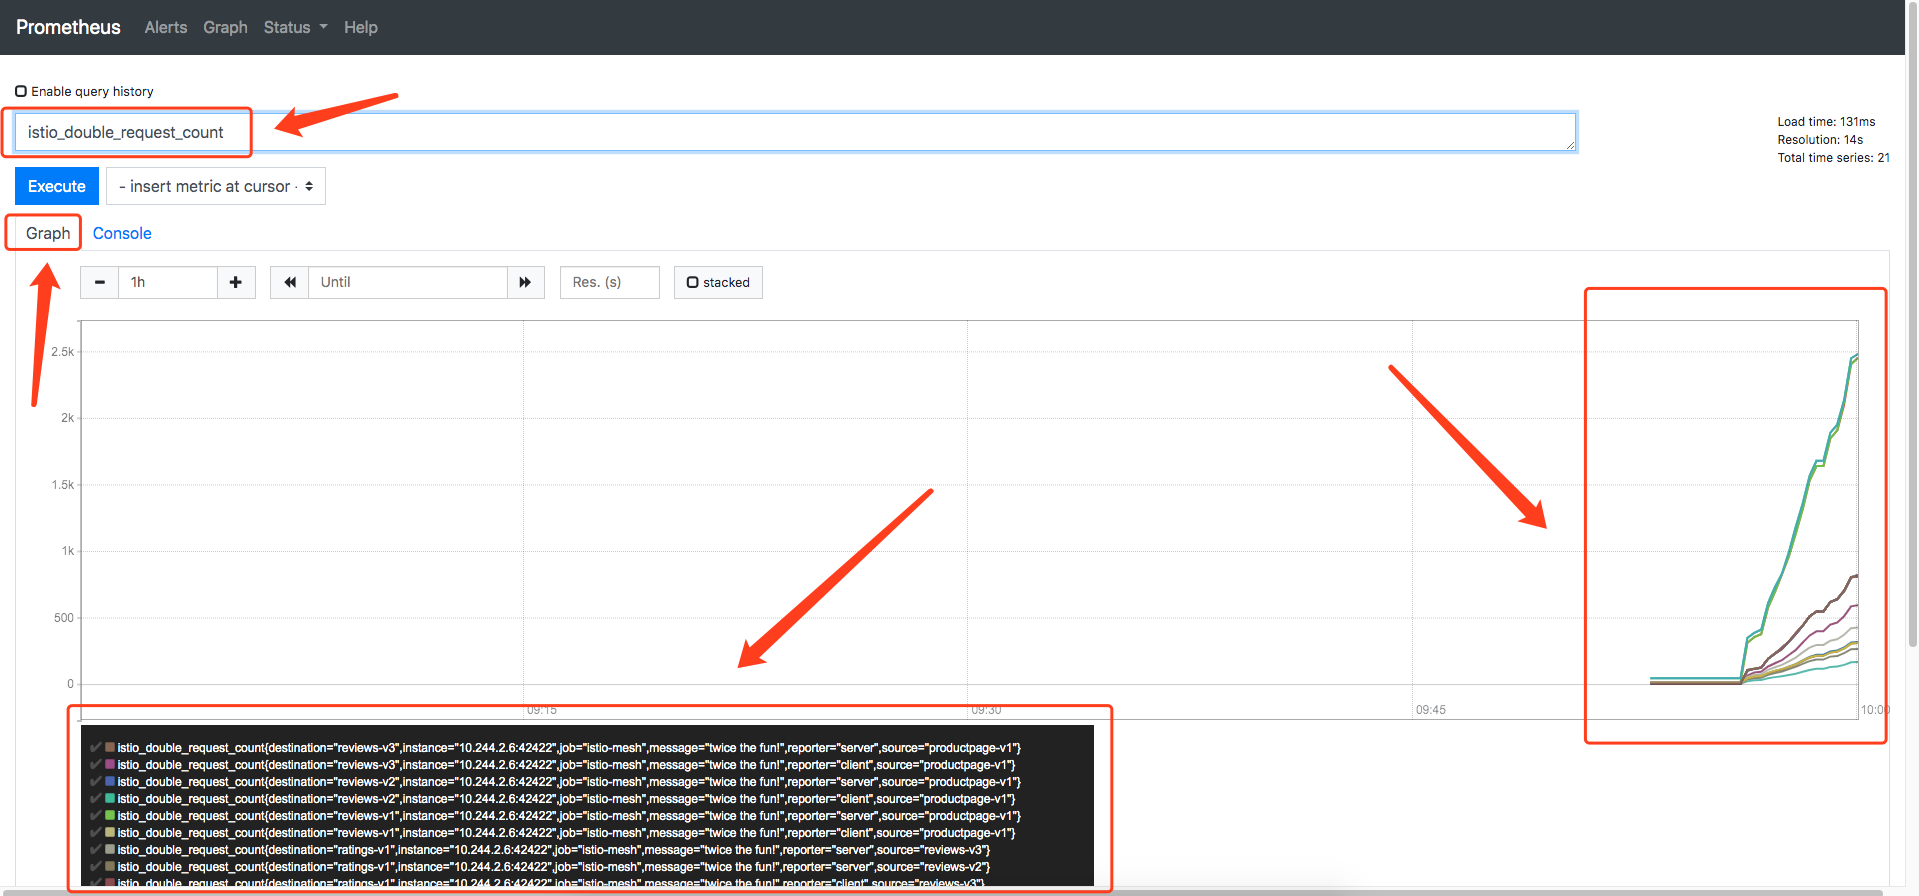
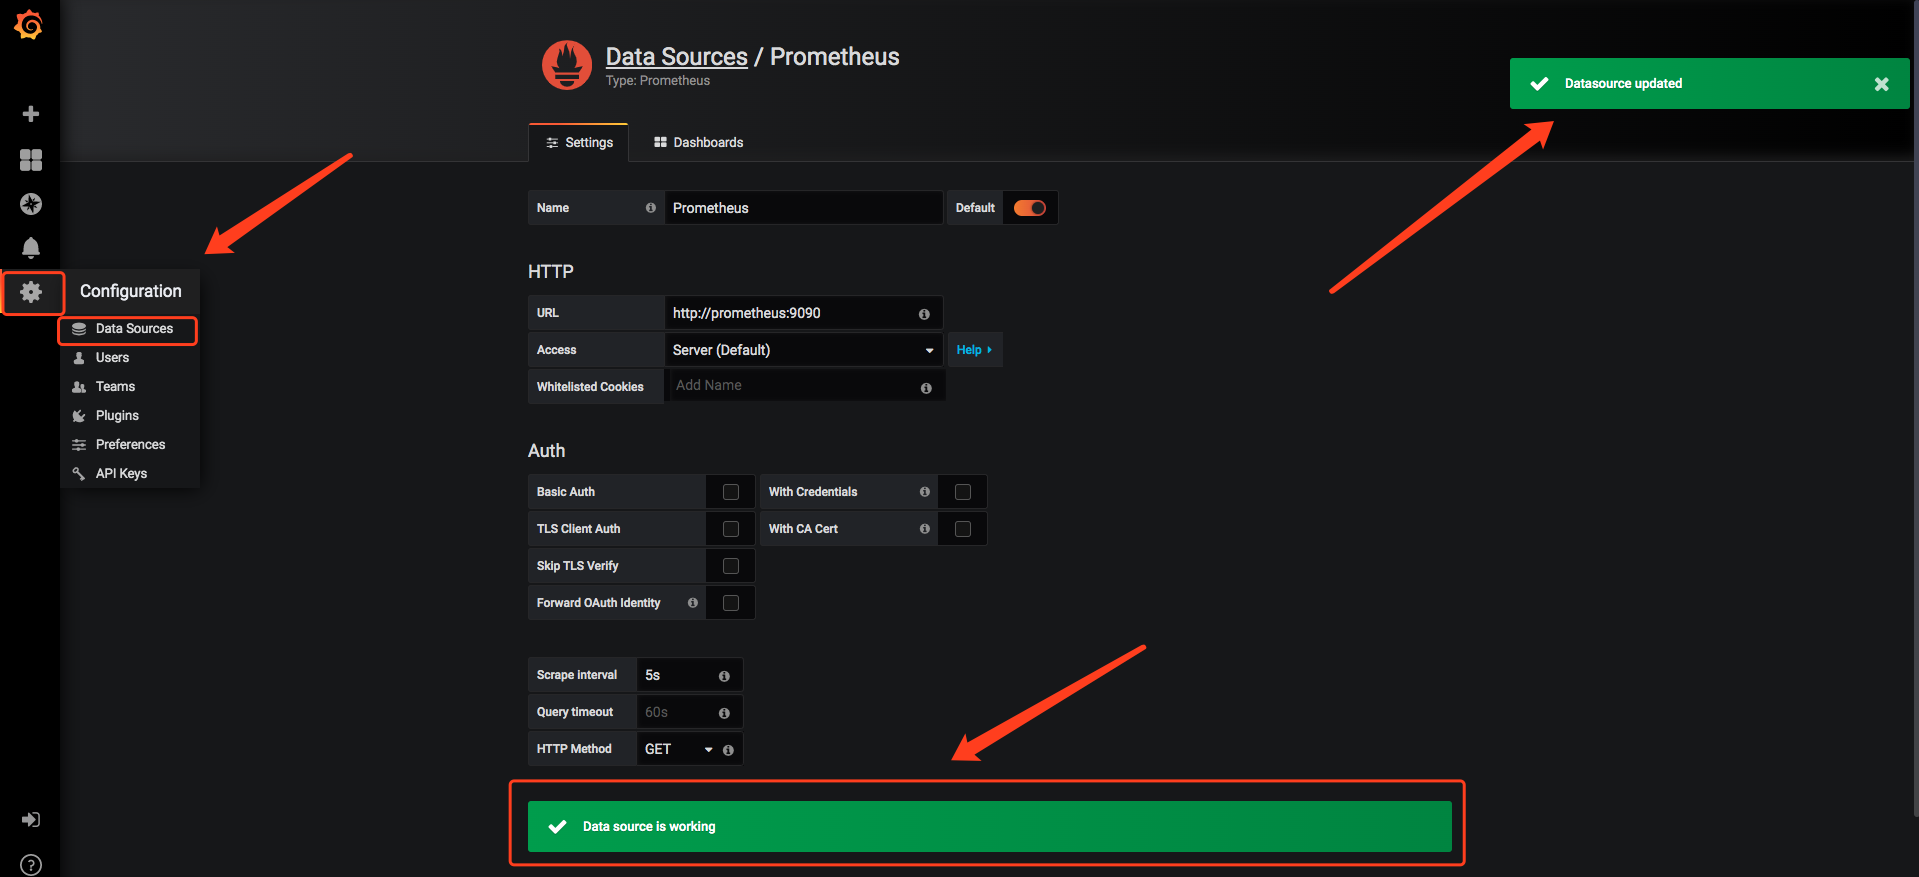
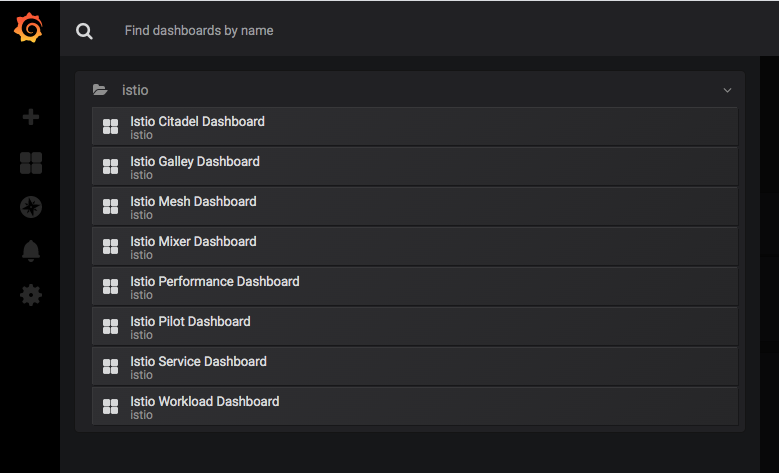
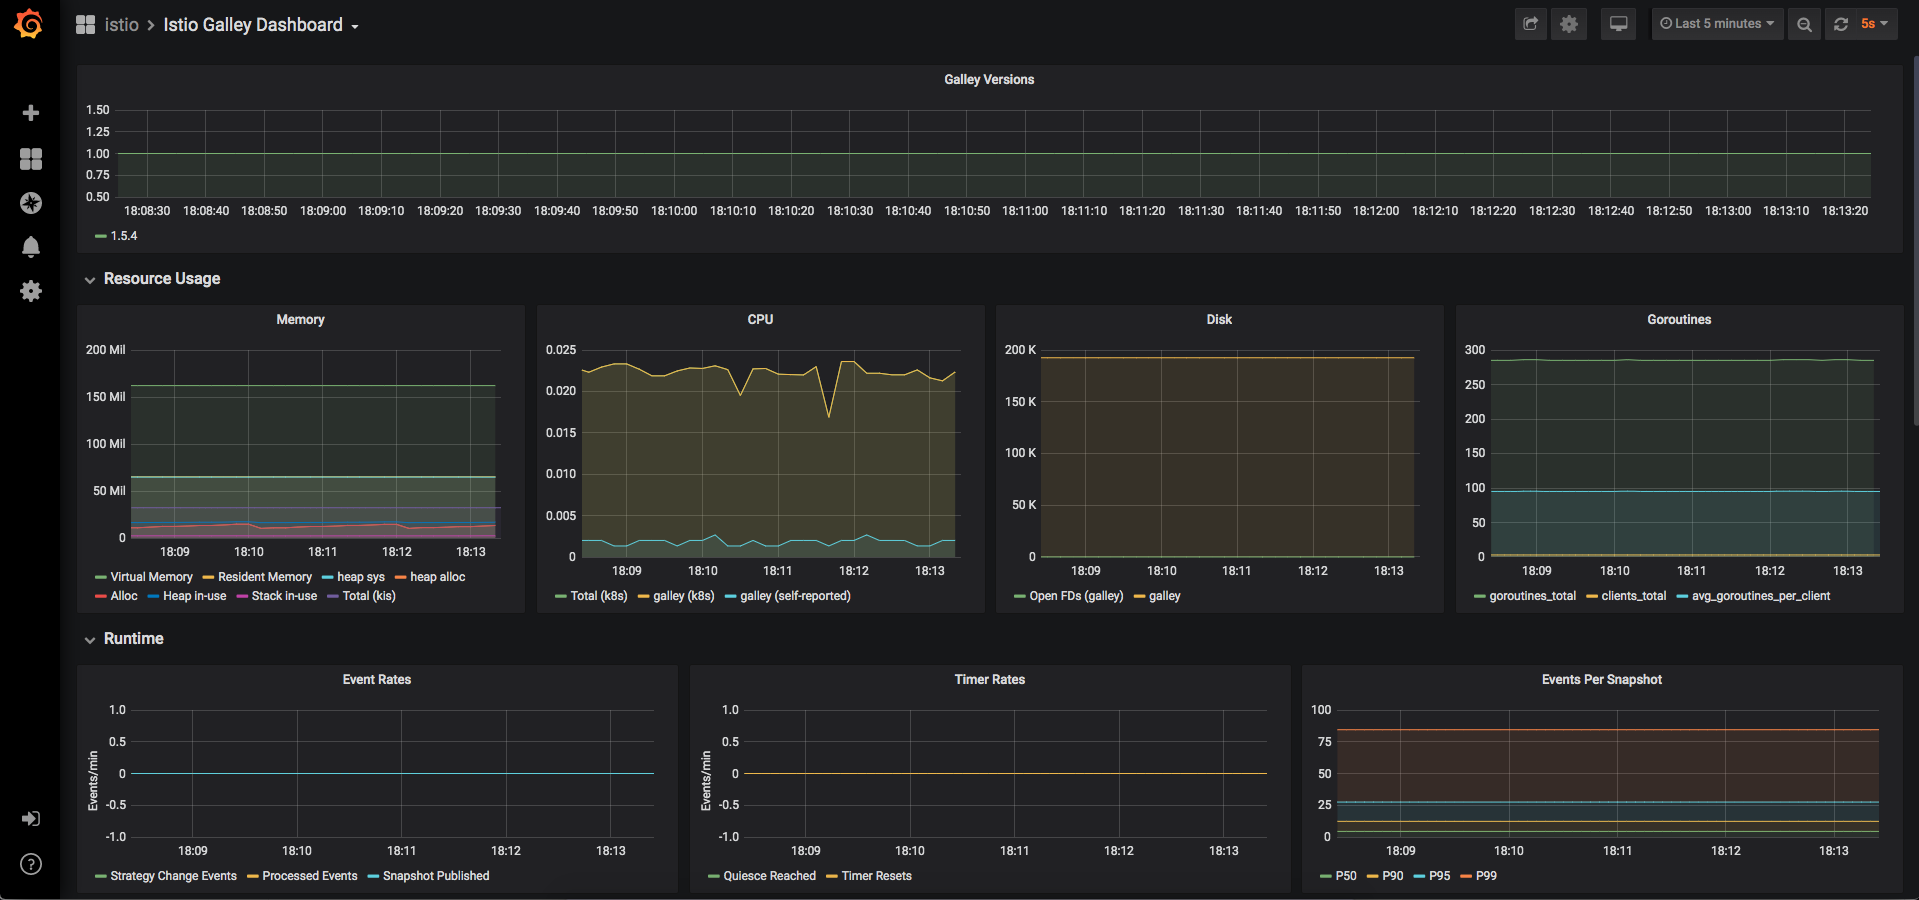
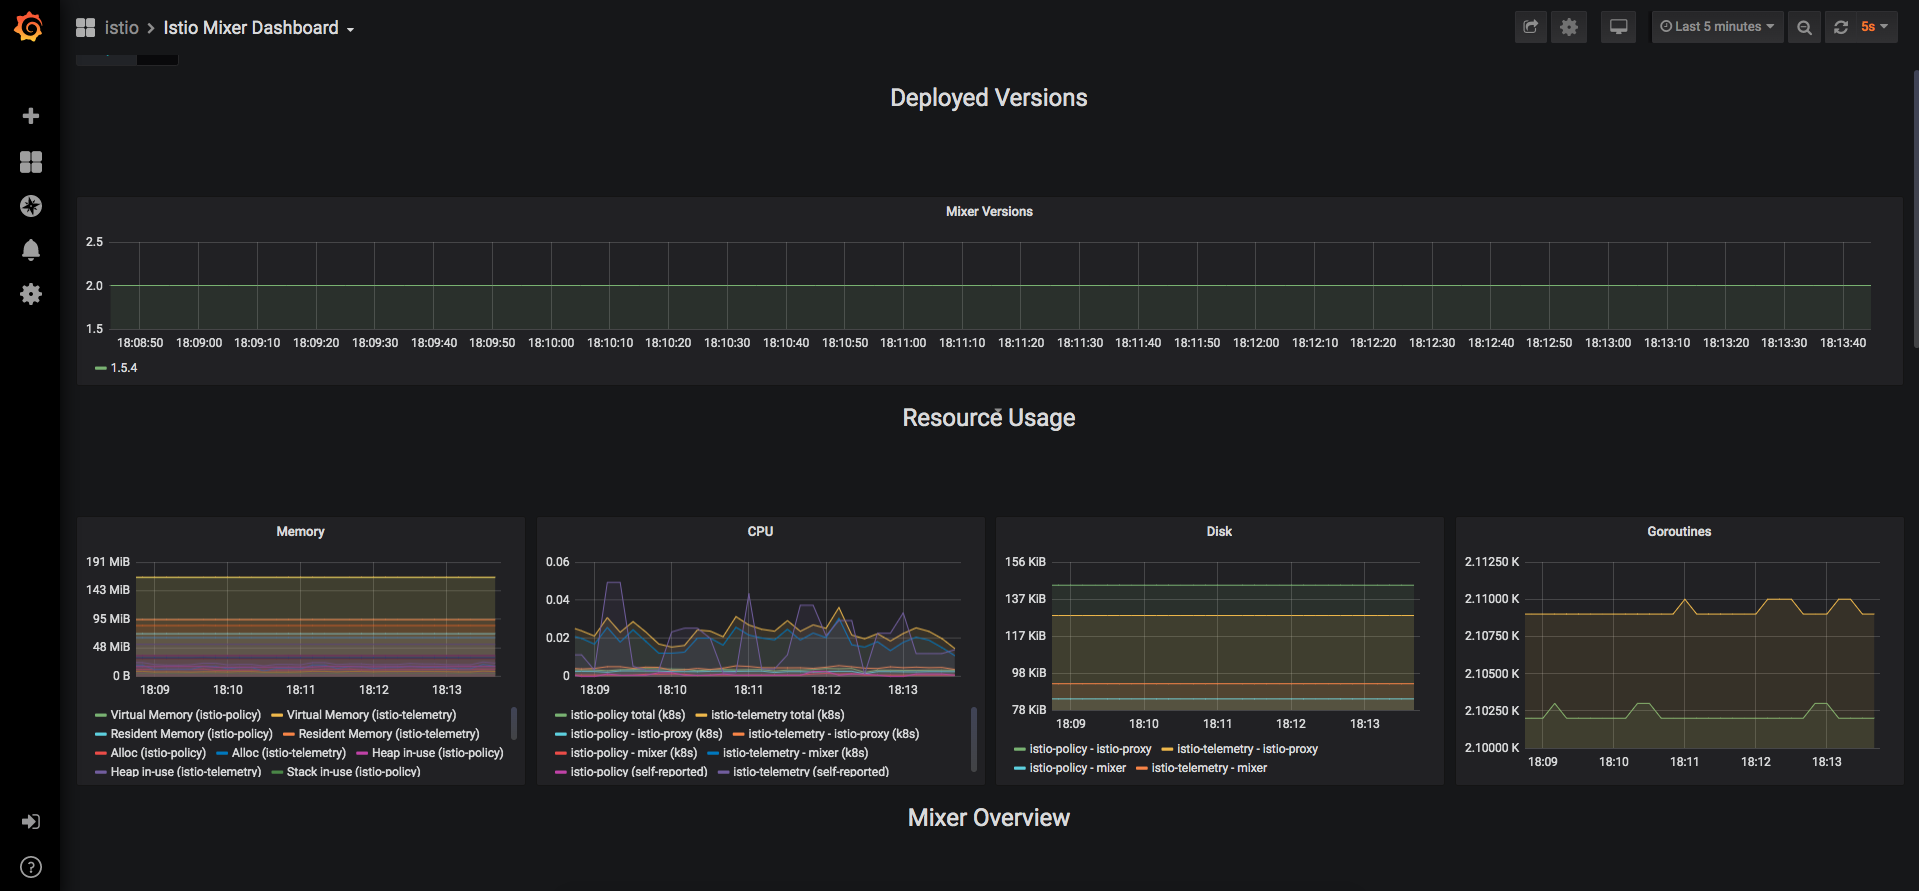
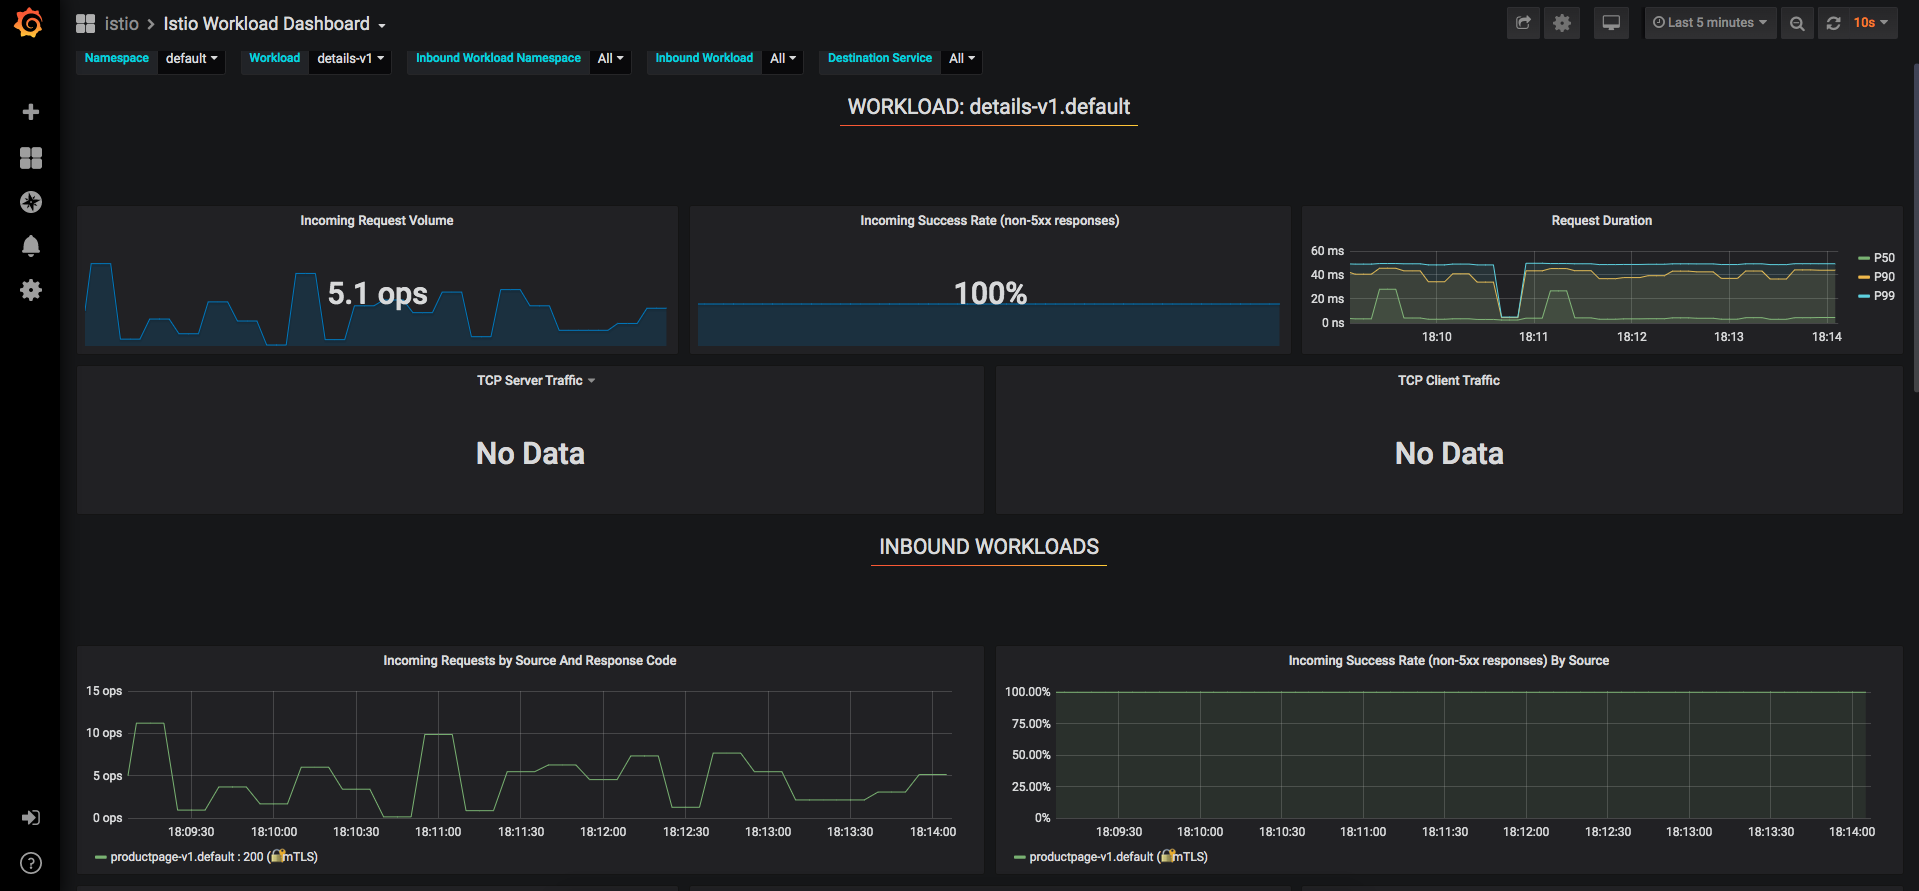
一、istio指标收集与查询 1、通过 Prometheus 查询度量指标123456789101112131415161718192021222324252627282930313233343536373839采集新的指标应用配置新指标的 YAML 文件,该指标将由 Istio 自动生成和采集kubectl apply -f metrics.yaml修改 prometheus 的 svc 模式由 ClusterIP 为 NodePortkubectl edit svc prometheus -n istio-system查看 prometheus 的端口kubectl get svc -n istio-system通过浏览器进行访问http://IP:PORT上述链接打开 Prometheus 并执行对 istio_double_request_count 指标值的查询语句因为没有数据,我们通过下列命令模拟产生数据,随便打开一个终端,执行以下命令watch -n 1 curl -o /dev/null -s -w %{http_code} http://182.61.167.80:31380/productpage其他查询:请求 productpage 服务的总次数:istio_requests_total{destination_service="productpage.default.svc.cluster.local"}请求 reviews 服务 V3 版本的总次数:istio_requests_total{destination_service="reviews.default.svc.cluster.local", destination_version="v3"}该查询返回所有请求 reviews 服务 v3 版本的当前总次数。过去 5 分钟 productpage 服务所有实例的请求频次:rate(istio_requests_total{destination_service=~"productpage.*", response_code="200"}[5m]) 2、使用 Grafana 可视化指标1234567891011修改 grafana 的 svc 模式由 ClusterIP 为 NodePortkubectl edit svc grafana -n istio-system查看 grafana 的端口kubectl get svc -n istio-system通过浏览器进行访问http://IP:PORT