EFK不是一个软件,而是一套解决方案,并且都是开源软件,之间互相配合使用,完美衔接,高效的满足了很多场合的应用,是目前主流的一种日志系统。EFK是三个开源软件的缩写,分别表示:Elasticsearch , Fluentd, Kibana
组件说明:
EFK由ElasticSearch、Fluentd和Kiabana三个开源工具组成。
1、其中Elasticsearch是一款分布式搜索引擎,能够用于日志的检索
2、Fluentd是一个实时开源的数据收集器,
3、Kibana 是一款能够为Elasticsearch 提供分析和可视化的 Web 平台。
这三款开源工具的组合为日志数据提供了分布式的实时搜集与分析的监控系统。
一、环境准备
1
2
3
4
5
6
7
8
9
10
11
12
13
14
15
| # 资源配置:
Master: 4U4G
Node-1: 4U4G
Node-2: 4U4G
mkdir efk
cd efk
kubectl create namespace efk
添加 Google incubator 仓库:
helm repo add bitnami https://charts.bitnami.com/bitnami
|
二、部署 Elasticsearch
1
2
3
4
5
6
7
8
9
10
11
12
13
14
15
16
17
18
19
20
21
22
23
24
25
26
27
28
29
30
31
32
33
34
35
36
37
38
39
40
41
42
43
| helm fetch bitnami/elasticsearch
tar zxvf elasticsearch-12.3.1.tgz
cd elasticsearch/
vim values.yaml
# 因为是实验环境,需要修改一下配置文件,否则可能会因为资源问题而导致实验失败
volumePermissions:
enabled: false # 修改为 “false”
image:
registry: docker.io
repository: bitnami/minideb
tag: buster
pullPolicy: Always
master:
name: master
replicas: 1 # 修改为 “1”
persistence:
enabled: false # 修改为 “false”
coordinating:
replicas: 1 # 修改为 “1”
updateStrategy:
type: RollingUpdate
data:
name: data
replicas: 1 # 修改为 “1”
persistence:
enabled: false # 修改为 “false”
# 保存退出
helm install . --name ela --namespace=efk -f values.yaml
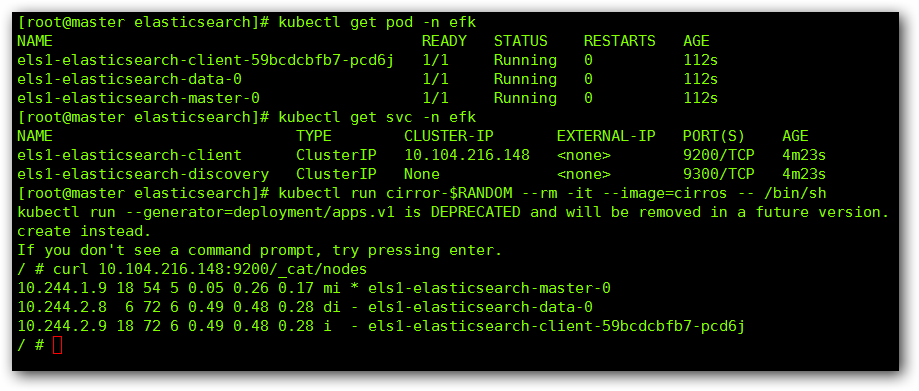
# 测试一下:
kubectl run cirror-$RANDOM --rm -it --image=cirros -- /bin/sh
curl Elasticsearch:Port/_cat/nodes
|
完成后我们查看一下:

三、部署 Fluentd
1
2
3
4
5
6
7
8
9
10
11
12
13
14
15
16
17
18
19
20
21
22
23
24
25
26
27
28
29
30
31
32
33
34
35
36
37
38
39
40
41
42
43
44
45
46
47
48
49
50
51
52
53
54
55
56
57
58
59
60
61
62
63
64
65
66
67
68
69
70
71
| helm fetch stable/fluentd
tar zxvf fluentd-2.4.1.tgz
cd fluentd
vim values.yaml
# 更改其中 Elasticsearch 访问地址
elasticsearch:
host: 'es-elasticsearch-coordinating-only' # 修改地址
port: 9200
scheme: 'http'
ssl_version: TLSv1_2
buffer_chunk_limit: 2M
buffer_queue_limit: 8
logstash_prefix: 'logstash'
在 system.conf 上方添加下列代码:
containers.input.conf: |-
<source>
@id fluentd-containers.log
@type tail
path /var/log/containers/*.log
pos_file /var/log/es-containers.log.pos
tag raw.kubernetes.*
read_from_head true
<parse>
@type multi_format
<pattern>
format json
time_key time
time_format %Y-%m-%dT%H:%M:%S.%NZ
</pattern>
<pattern>
format /^(?<time>.+) (?<stream>stdout|stderr) [^ ]* (?<log>.*)$/
time_format %Y-%m-%dT%H:%M:%S.%N%:z
</pattern>
</parse>
</source>
<match raw.kubernetes.**>
@id raw.kubernetes
@type detect_exceptions
remove_tag_prefix raw
message log
stream stream
multiline_flush_interval 5
max_bytes 500000
max_lines 1000
</match>
vim templates/deployment.yaml 在 volumeMounts 与 volumes 下方进行挂载:
volumeMounts:
- name: varlog
mountPath: /var/log
- name: dockercontainers
mountPath: /var/lib/docker/containers
readOnly: true
volumes:
- name: varlog
hostPath:
path: /var/log
- name: dockercontainers
hostPath:
path: /var/lib/docker/containers
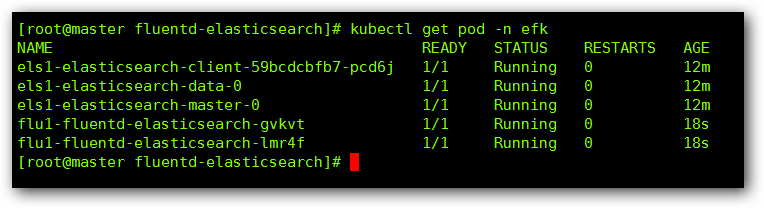
helm install . --name flu --namespace=efk -f values.yaml
|
完成后查看:
四、部署 kibana
1
2
3
4
5
6
7
8
9
10
11
12
13
14
15
16
17
18
19
20
21
22
23
24
25
26
27
| helm fetch bitnami/kibana
# 这里要特别注意一下,Kibana 的版本要与Elasticsearch 的版本一直,否则会出错,需要特别、特别注意
tar zxvf kibana-5.1.2.tgz
cd kibana/
vim values.yaml
# 更改其中 Elasticsearch 访问地址
# 更改 Service 中的 ClusterIP 为 NodePort
elasticsearch:
hosts:
- es-elasticsearch-coordinating-only
port: 9200
service:
port: 80
type: NodePort
volumePermissions:
enabled: false
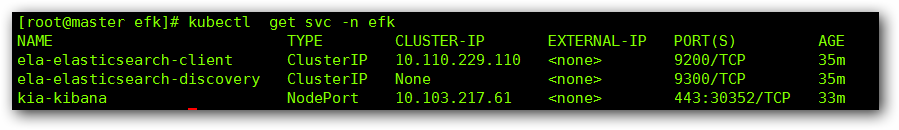
helm install . --name kia --namespace=efk -f values.yaml
|
完成后查看效果:
通过暴露的端口号,进行 WEB 访问:
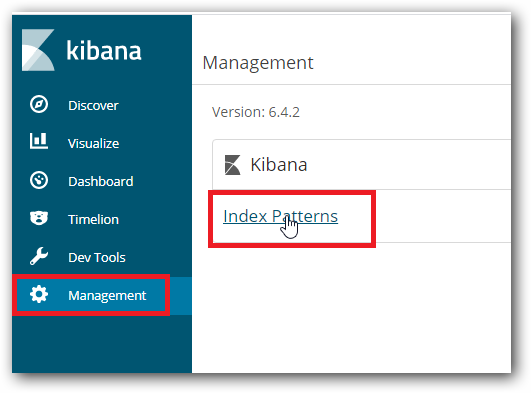
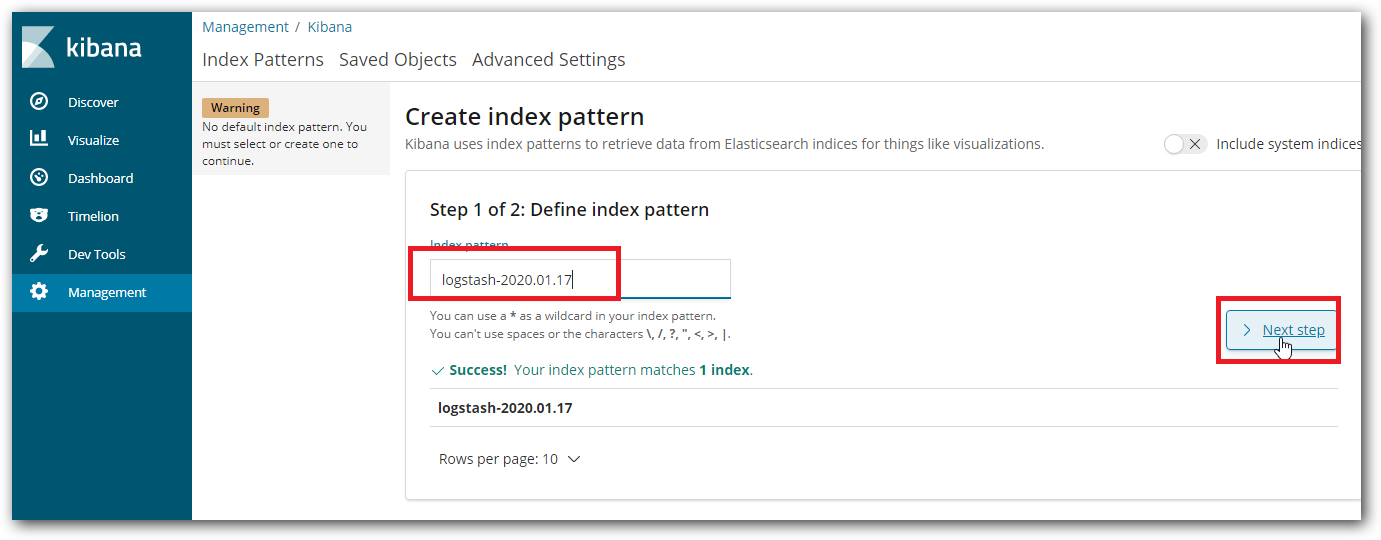
创建一下索引序列:
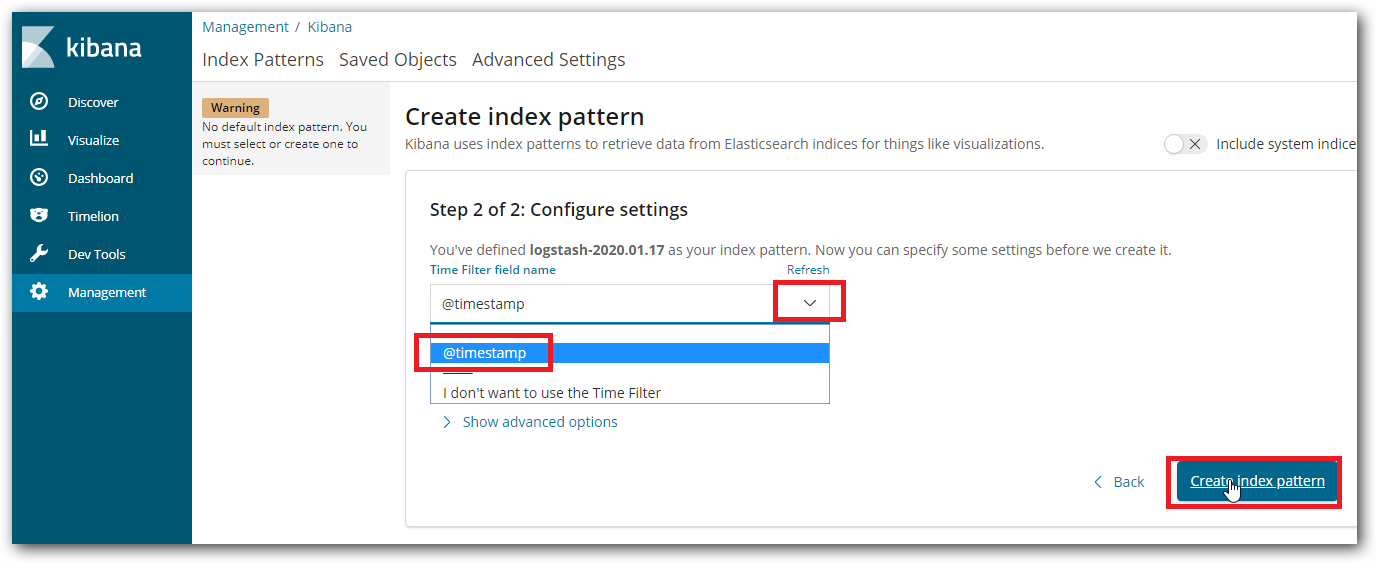
我们来以时间为例,创建索引:
通过时间序列分片:
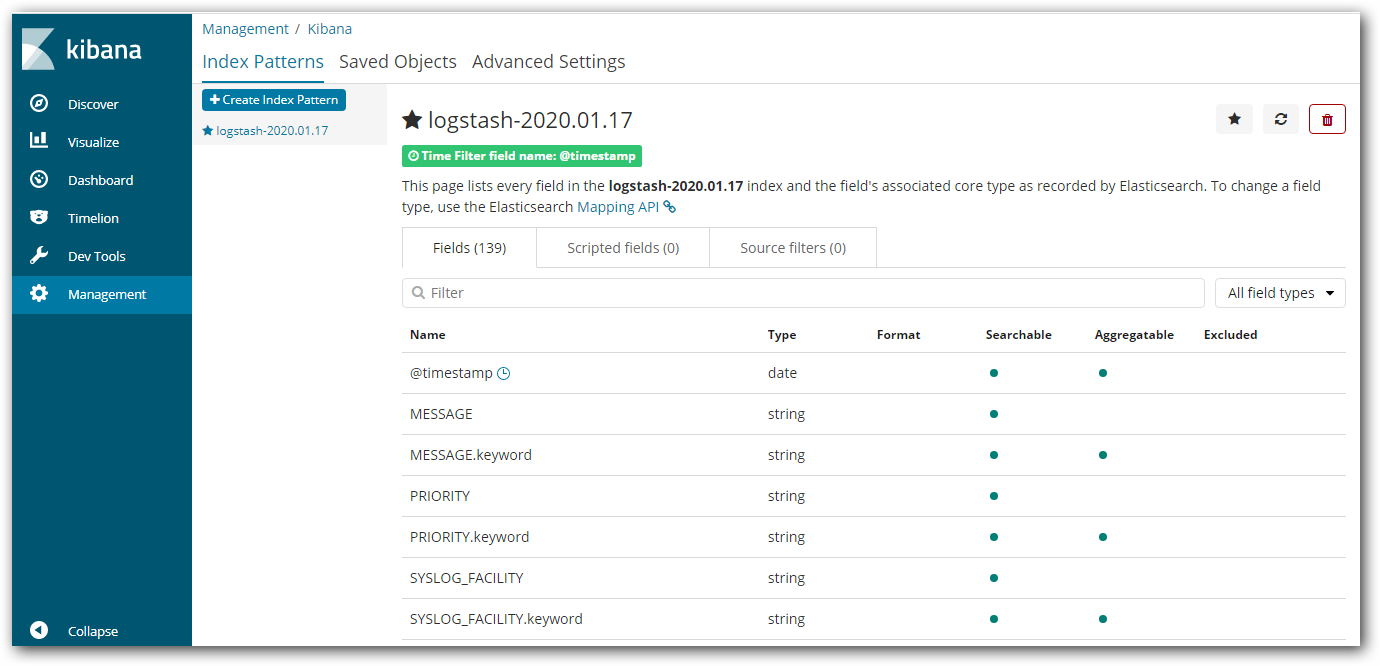
分片成功:
查看我们收集的日志信息: